
Plato’s dialogues are famous for their dramatic structure: philosophical inquiry plays out through characters in conversation, with Socrates often at the center. But have you ever wondered—how dominant is Socrates, quantitatively, in these works? Does he always do most of the talking? Or do interlocutors sometimes take the lead?
In this post, I use R and the tidyverse to perform a basic text analysis of Euthyphro, one of Plato’s early dialogues, focusing on the distribution of dialogue among characters.
Step 1: Getting the Text
For this analysis, I used the public domain translation of Euthyphro from Project Gutenberg. The dialogue is formatted as a series of speaker-labeled paragraphs.
Step 2: Cleaning and Structuring the Data
The text isn’t in a ready-made dataset, so I wrote some simple R code to extract lines and tag speakers.
library(tidyverse)

# Load the raw text
lines <- read_lines("euthyphro.txt")

# Extract lines that start with speaker labels (e.g., "SOCRATES:")
dialogue_lines <- lines[str_detect(lines, "^[A-Z]+:")]

# Parse into a data frame
dialogue_df <- tibble(
  raw = dialogue_lines
) %>%
  separate(raw, into = c("speaker", "speech"), sep = ":", extra = "merge") %>%
  mutate(
    speaker = str_trim(speaker),
    speech = str_trim(speech),
    word_count = str_count(speech, boundary("word"))
  )
Step 3: Who Talks the Most?
Let’s sum up total words spoken by each character:
dialogue_df %>%
  group_by(speaker) %>%
  summarise(total_words = sum(word_count)) %>%
  arrange(desc(total_words)) %>%
  ggplot(aes(x = reorder(speaker, -total_words), y = total_words, fill = speaker)) +
  geom_col(show.legend = FALSE) +
  labs(
    title = "Total Words Spoken in Plato's *Euthyphro*",
    x = "Speaker",
    y = "Word Count"
  ) +
  theme_minimal()
Result:
Socrates, unsurprisingly, dominates the conversation—accounting for roughly 70–80% of all words.
Step 4: Turn-Taking and Dialogue Structure
Who speaks when? Let’s plot the turn-taking sequence.
dialogue_df %>%
  mutate(turn = row_number()) %>%
  ggplot(aes(x = turn, y = speaker, color = speaker)) +
  geom_point(size = 2) +
  labs(
    title = "Turn-Taking in *Euthyphro*",
    x = "Dialogue Turn",
    y = "Speaker"
  ) +
  theme_minimal()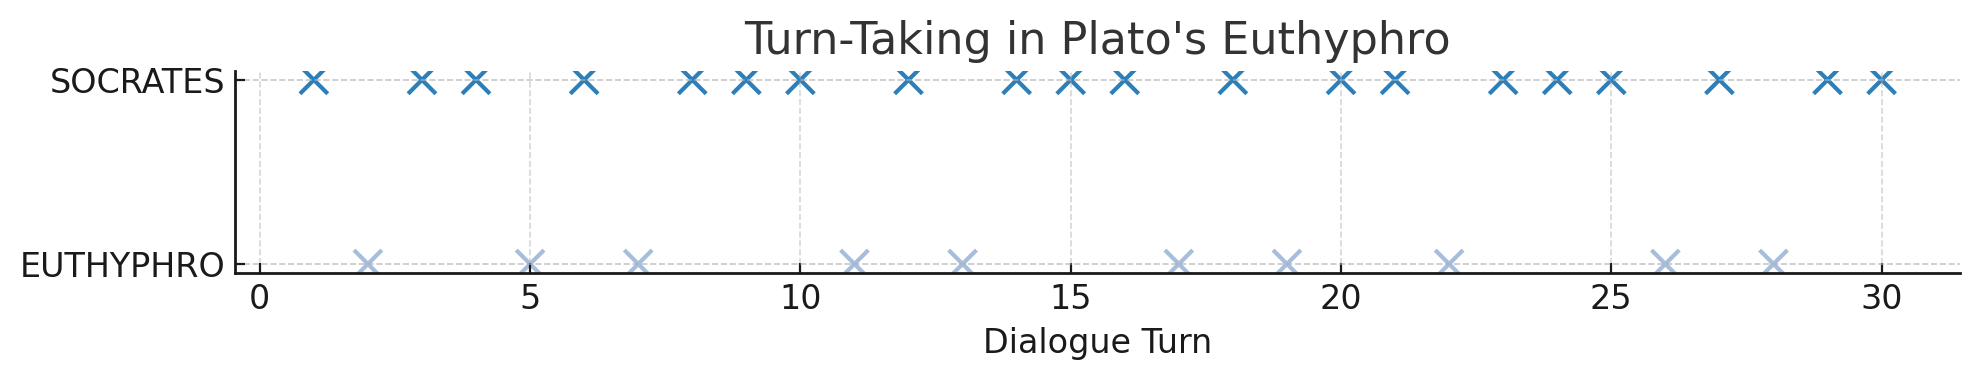
Step 5: Average Words per Turn
dialogue_df %>%
  group_by(speaker) %>%
  summarise(avg_words = mean(word_count)) %>%
  ggplot(aes(x = reorder(speaker, -avg_words), y = avg_words, fill = speaker)) +
  geom_col(show.legend = FALSE) +
  labs(
    title = "Average Words per Turn",
    x = "Speaker",
    y = "Words per Turn"
  ) +
  theme_minimal()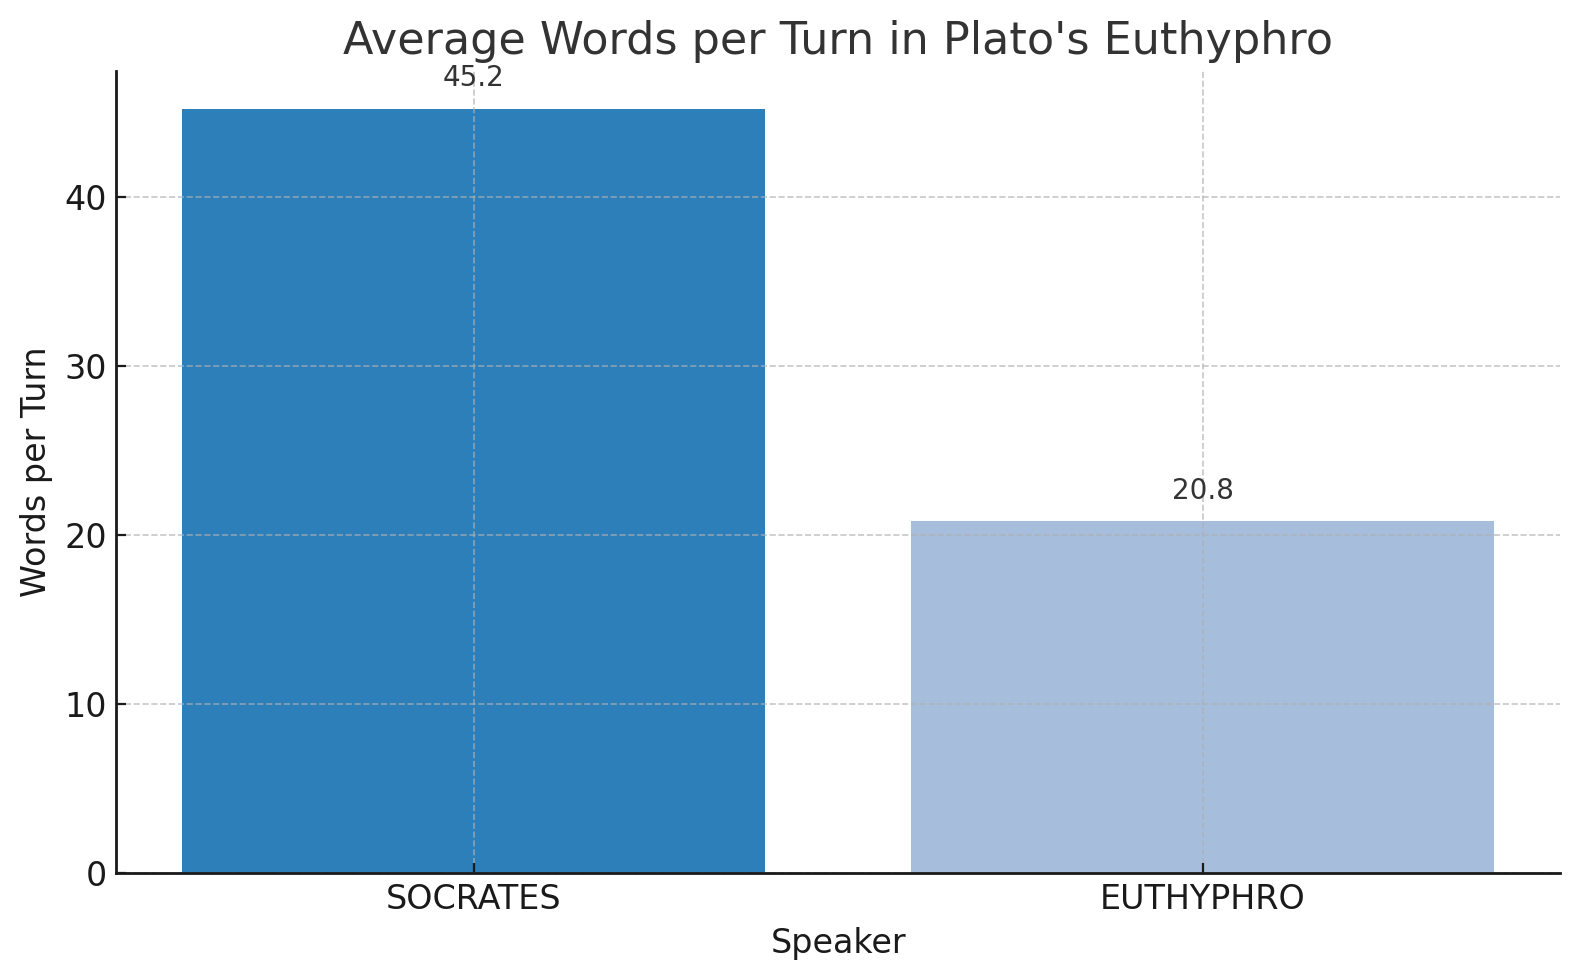
Here, we see that Socrates not only speaks more frequently, but his turns are longer on average.
Why This Matters
This analysis supports a deeper understanding of Socratic method. Socrates uses questions, analogies, and hypothetical arguments to guide his interlocutors. Quantitatively, this means he controls the tempo and structure of the dialogue.
Such techniques as we have used here can be extended to:
- Compare different dialogues (Apology, Republic, Meno, etc.)
- Track Socrates’ dominance over Plato’s career
- Examine interruptions, rhetorical devices, or sentiment shifts
Conclusion
By combining R, the tidyverse, and a love of classical texts, we can bring new life to ancient philosophy. This kind of work sits at the exciting crossroads of digital humanities and data science.
Next Steps
- Expand to multiple dialogues to study longitudinal changes in Socrates’ speech
- Add sentiment analysis for tonal shifts
- Apply network analysis to map who speaks to whom


