
When a small research team reached out to me looking for help with data consolidation, I saw a great opportunity to apply my Python skills to a real-world workflow problem. Their process involved manually copying data from dozens of Excel files into a master spreadsheet every week—and then summarizing those results in a report. It was slow, error-prone, and draining valuable time from their actual research.
In this post, I’ll walk through how I built a simple ETL (Extract, Transform, Load) pipeline using Python, pandas, openpyxl, and matplotlib to streamline their data process and automate reporting.
Project Goals
- Extract data from multiple Excel workbooks with slightly inconsistent formatting
- Transform the data into a clean, standardized structure
- Load the combined data into a single master file for reporting
- Visualize key trends using simple plots
- Add validation checks and logging to ensure reliability
Step-by-Step: How I Built It
1. 📂 Project Setup
I organized the pipeline into the following file structure:
project/
│
├── input_data/
│   └── [raw Excel files here]
│
├── output/
│   ├── cleaned_master.xlsx
│   └── summary_report.pdf
│
├── logs/
│   └── pipeline.log
│
├── pipeline.py
└── config.yaml
I also created a simple config.yaml file to store things like input/output paths and expected column headers. This made it easy to adjust the setup without touching the main code.
2. 📥 Extraction
Each Excel file had one sheet of data but sometimes the formatting varied—extra header rows, slightly different column names, etc. I used openpyxl and pandas to read and parse each file:
import pandas as pd
import openpyxl
import os

def load_excel_files(input_dir):
    all_data = []
    for file in os.listdir(input_dir):
        if file.endswith(".xlsx"):
            df = pd.read_excel(os.path.join(input_dir, file), engine="openpyxl")
            all_data.append(df)
    return all_data
I also implemented a basic validation check to make sure each file had the required columns (using fuzzy matching if needed).
3. 🔧 Transformation
Once I had the dataframes, I applied cleaning steps to:
- Standardize column names (
.str.lower().str.strip()) - Drop empty rows and columns
- Convert date strings to
datetime - Normalize categorical values (e.g., turning “Yes”, “YES”, “yes” into “Yes”)
Then I concatenated all the cleaned dataframes into a master dataset:
combined_df = pd.concat(cleaned_dfs, ignore_index=True)To help the team catch issues early, I added assertions and logging:
assert not combined_df.isnull().any().any(), "Missing values found!"import logging
logging.basicConfig(filename='logs/pipeline.log', level=logging.INFO)
logging.info(f"Successfully loaded {len(cleaned_dfs)} files at {pd.Timestamp.now()}")4. 📊 Reporting & Visualization
Using matplotlib, I created a simple time-series line plot showing trends across the research period:
import matplotlib.pyplot as plt

fig, ax = plt.subplots()
combined_df.groupby("month")["participants"].sum().plot(kind='line', ax=ax)
plt.title("Monthly Participant Count (2023-2024)"
plt.xlabel("Month")
plt.ylabel("Participants")
plt.savefig("output/summary_report.pdf")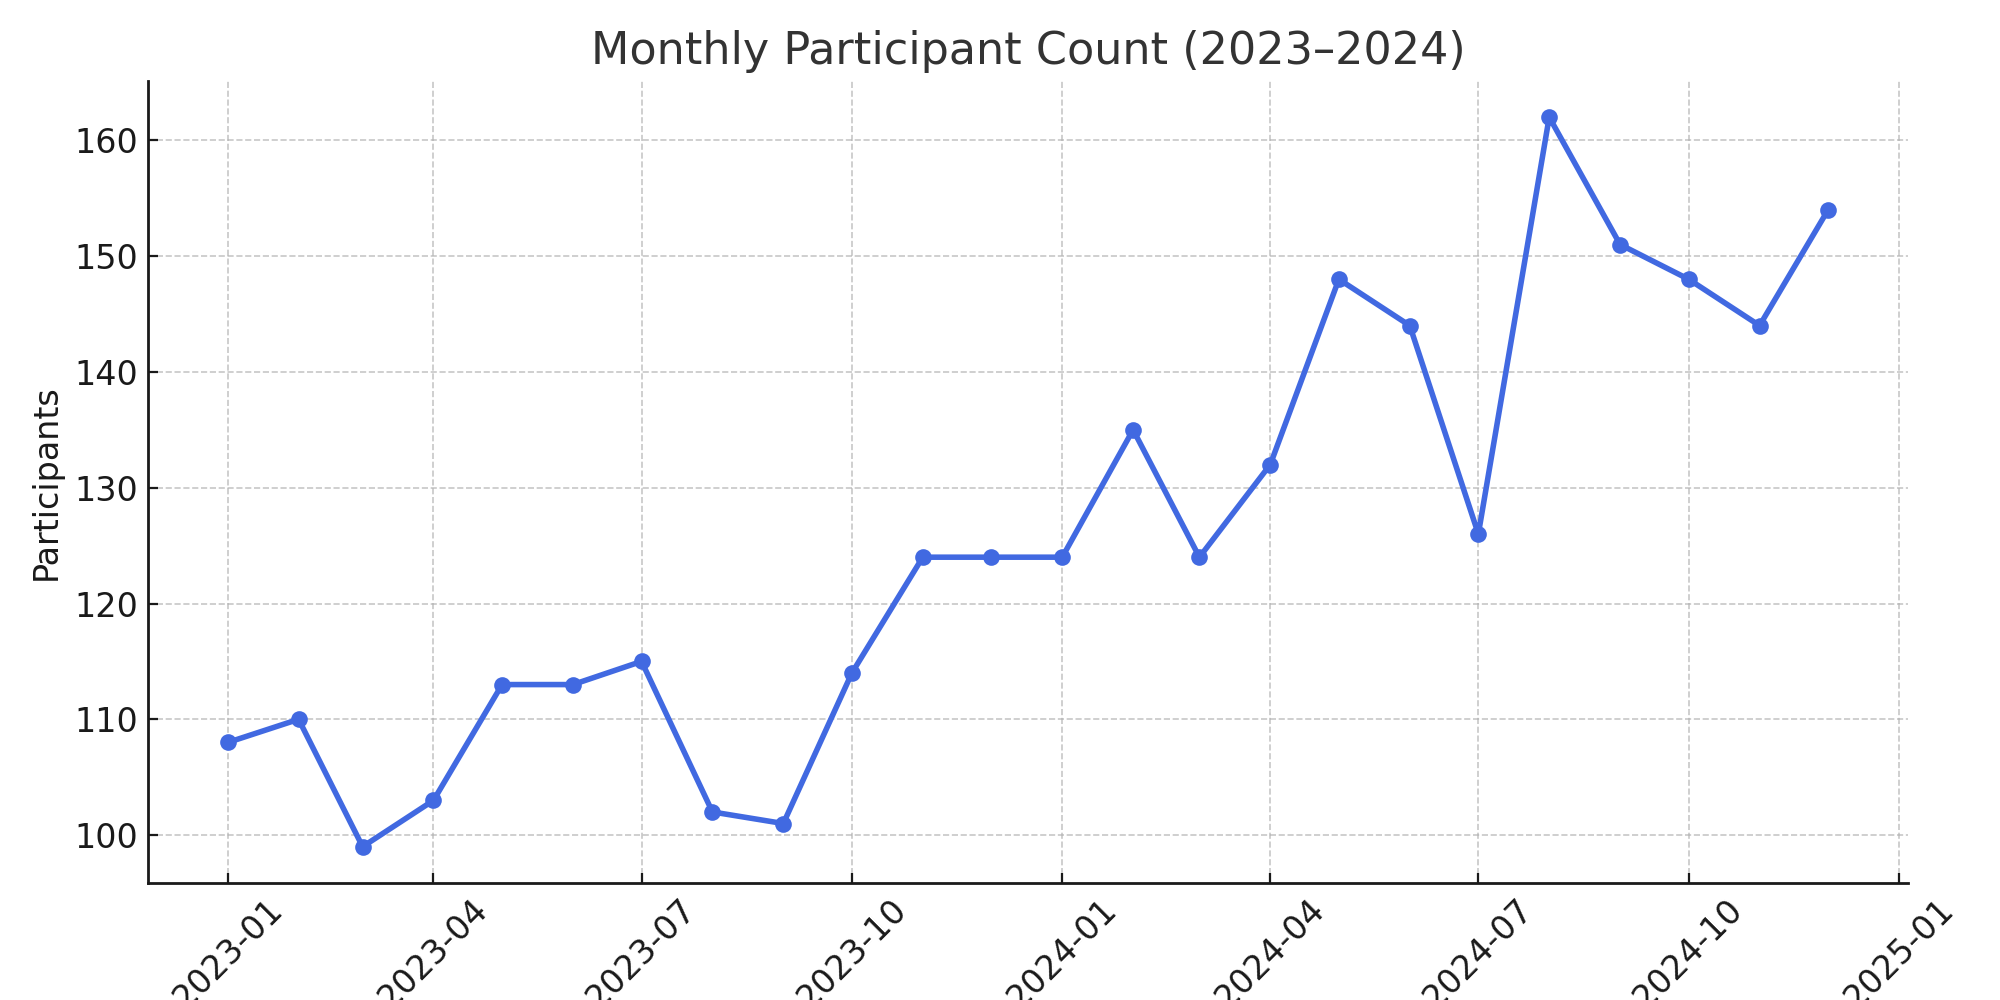
The team could easily include these plots in their presentations and grant reports.
5. 💾 Output & Automation
I exported the final master dataset to Excel with one command:
combined_df.to_excel("output/cleaned_master.xlsx", index=False)
To wrap everything up, I turned the script into a runnable pipeline.py and included comments and usage instructions.
What I Learned
- Working with real data means handling inconsistency and building in safeguards
- Logging and validation can prevent silent errors
- Even a small data pipeline can save hours of manual work
- Communication with non-technical stakeholders is key—I provided documentation and demoed the script
Outcome
After deploying the script, the research team told me they reduced their weekly data processing time from 3 hours to under 10 minutes. Better yet, the reports were more accurate and consistent—freeing them up to focus on insights, not spreadsheets.
Thanks for reading!
If you're working with messy Excel files and want to automate your reporting, feel free to reach out or check out the code (available on request).


